Analyse Your Trading Performance Effectively
Successful traders all have one habit in common – scheduling time to regularly review past trades. This could be done, say, at the end of every week or month – the frequency isn’t as important as doing it consistently, however, the more often you review your trades the less time you need to spend and the sooner you can start correcting mistakes.
It is only by looking at past performance that you can gain real awareness and paint an accurate picture of where you are at in your trading journey. Analysis takes the guesswork out of what it is you keep doing wrong that is giving you the results you keep getting.
Committing to this intentional practice is also great for your psychology, as your brain is subconsciously storing another piece of evidence that you are conducting yourself the way a professional and disciplined trader would.
You need to have an investigative mindset when reviewing trades and go searching for clues. This approach can reveal information such as mistakes you may not have otherwise realised you were repeating, patterns in your trading you were not aware you had (both good and bad), and whether you made decisions based on emotion or logic.
A good habit to get into is to add one last journal entry in VEMA Trader each time a trade is closed. This entry should be a brief note about how the trade played out, such as ‘Nailed it!’, ‘TA was way off’, ‘Glad I moved my SL up’, ‘Moved SL too soon’, ‘Took profit too early’ or ‘Profit target was too ambitious’.
Analysis Cards
One of the key components of VEMA Trader that sets it apart from anything you have seen before is its analysis cards. This feature allows users to track performance, compare results using different trading strategies and identify strengths and weaknesses.
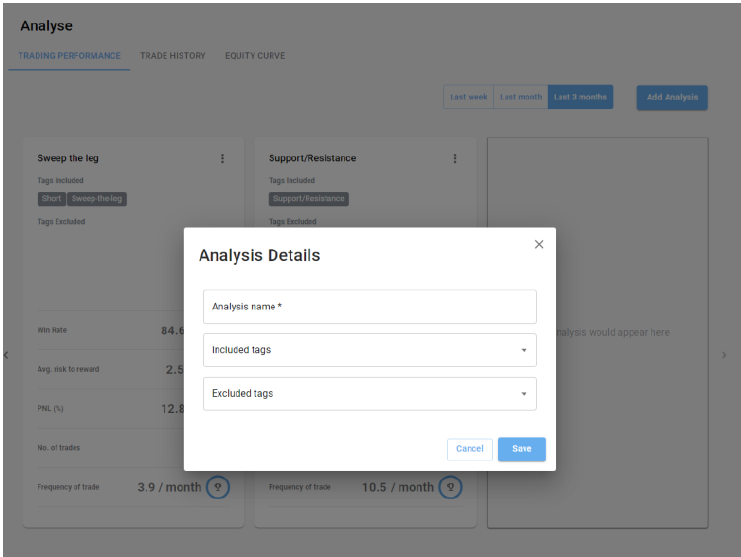
In our last blog we took a look at VEMA Trader’s ‘Tags’ feature, and it is these tags that are used to generate Analysis cards in the Trading Performance screen. For each new Analysis generated, users give the card a name and can choose to include and/or exclude tags.

Each card displays your win rate, average risk to reward ratio, Profit and Loss (PNL), number of trades that have matching tags, and how many trades you average per month for that particular set of tags.

The possibilities for filter combinations are endless and you can create as many different analysis cards as you wish.
The Trading Performance feature really comes into play once you have executed a large number of trades in VEMA Trader. As the number of trades you execute increases, so too will the depth of your results.
By comparing multiple Analysis cards, you could discover that your winning formula is to go long on the 1 hour timeframe using a bounce strategy.
On the flip side, and just as importantly, you can use filters to identify where you have room for improvement. Now you are armed with invaluable knowledge that you can use to fine-tune your skills.
To learn more about our analysis cards watch our tutorial video.
In our next blog we will show you how to take your analysis one step further by taking an Analysis card and examining each of the trades captured in that card.
By Sam Sillett


